Stats On City’s Most Dangerous Intersections
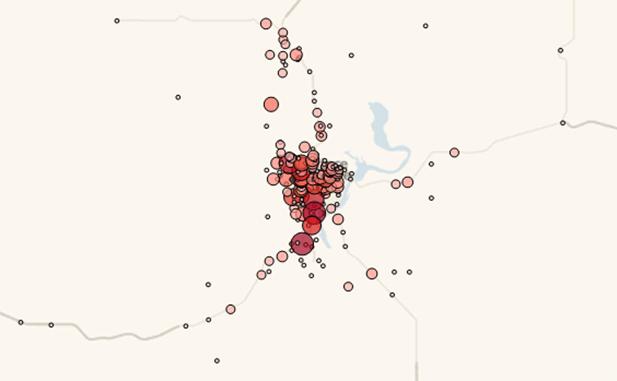
Map showing clusters of intersection casualty crashes in 2011 courtesy ICBC
Prince George, BC – When the Insurance Corporation of BC releases its annual statistics on the most dangerous intersections in the province, Domano Boulevard and Highway 16 is always near the top of the list…
To give drivers an even clearer picture of the number of crashes that occur at city intersections – and, perhaps, pause for somber thought – ICBC now has an interactive map available giving residents in Prince George a first-hand look at where all crashes have occurred in a given year.
Five years worth of statistics are available – from 2007 to 2011 – and the data is bound to make you think twice the next time you approach a yellow light.
| Year | Casualty Crashes | Casualty and Property Damage Totals |
| 2007 | 561 | 1,517 |
| 2008 | 519 | 1,430 |
| 2009 | 456 | 1,317 |
| 2010 | 443 | 1,101 |
| 2011 | 514 | 1,370 |
The table below lists the top intersections for crashes in the past three years:
| Year | Casualty Crashes | All |
| 2009 | Domano & Hwy 16 (22) | Domano & Hwy 16 (54) |
| Ferry Ave & Hwy 16 (17) | Ferry Ave & Hwy 16 (44) | |
| Hwy 16 & Hwy 97 (13) | Hwy 16 & Hwy 97 (35) | |
| 5th Ave & Hwy 97 (10) | 5th Ave & Hwy 97 (25) | |
| 15th Ave & Patricia (9) | 15th Ave & Patricia (24) | |
| 2010 | Ferry Ave & Hwy 16 (17) | Ferry Ave & Hwy 16 (44) |
| Domano & Hwy 16 (13) | Domano & Hwy 16 (38) | |
| 15th Ave & Hwy 97 (12) |
Hwy 16 & Hwy 97 (26) |
|
| 15th Ave & Ospika (11) | 15th Ave & Hwy 97 (25) | |
| 10th Ave & Carney (9) | 5th Ave & Ospika (24) | |
| 2011 | Domano & Hwy 16 (17) | Domano & Hwy 16 (44) |
| Ferry Ave & Hwy 16 (17) | Ferry Ave & Hwy 16 (41) | |
| 5th Ave & Ospika (14) | Hwy 16 & Hwy 97 (41) | |
| Hwy 16 & Hwy 97 (14) | Massey & Westwood (33) | |
| 10th Ave & Hwy 97 (11) | 5th Ave & Ospika (26) |
To view the ICBC’s intersection crash site map, click here.
Comments
It’s surprising to me that there are not more crashes! The number of speeding, tailgating and changing lanes (without signalling) episodes one can observe just by driving 20 or 25 kilometers across town are astounding!
I have now installed a dash cam.
And add morons on their electronic devices.
It does its job without any effort by the driver. As soon as the car is started it begins to record in HD video mode any moron who would stupidly run into me. It’s approved by the courts as evidence and would make the job of ICBC that much easier. It even has a night time mode! Win-win situation, for me.
Hope its evidence won’t be needed, ever.
How about more of a warning when the lights go from green to red. Look at parts of intersections that have warning of a light change, one can come to a nice smooth stop.
In Europe a lot of intersections have the lights operate like this, green, flashing yellow, steady yellow, then red. More of a warning.
Whats astounding is the amount of people that are so concerned with the way other people are driving. I even heard of this one clown installing a dash cam. Can you believe it?
A longer warning period might help.
I think the best, however, is a delay in the direction light changes. In other words, the signals should be red both ways for say 5 seconds.
Test the time delay over time against crashes resulting from intentionally running red lights.
[ur]http://www.youtube.com/watch?v=9RTs1B9_GuU[/url]
http://www.youtube.com/watch?v=9RTs1B9_GuU
I didn’t know that a flashing yellow was used anywhere but that’s what I came up with for a suggestion several years ago and suggested to the MoH. A longer red in both directions though only adds to the problem. People soon learn to rely on it and take advantage of it. If, as soon as one direction goes red, the other goes green, people learn that there is no delay and red light running slows down dramatically.
I didn’t mean you PrinceGeorge, I see too many people driving while on their phones. It’s the new impaired driving and needs to be treated as such.
To give an idea of the relative danger of particular intersections, the gross accident numbers should be divided by the traffic through the intersection. With un-normalized figures you can’t really tell whether there are a lot of accidents because an intersection is dangerous or because there is a lot of traffic through it.
Funny, but in Vancouver, when a light turns yellow, people stop. The police must have really cracked down on it there. That also works wonders.
People can make the red longer all on their own. If you are first at the intersection when the light changes don’t for 2 seconds and look both ways before proceeding. It could save your life. Flashing lights are for some, a que to speed up because they know the light is going to change.
Getting people to slam on the brakes when they see a yellow light is not a great idea in a place like PG where there is snow and ice on the roads a good part of the time. It’s better for people to slow down and prepare to stop, with yellow on for a decent interval.
You beat me to it NoWay. Put the “delay” in yourself. Thhe only problem with this is occasionally you have Mr Impatient behind you that feels the need to honk their horn .5 of a second after the light changes.
On another note, the yellow lights are plenty long to stop safely if you are driving at the speed limit (or driving to conditions, ie winter). People also need to learn to read the intersection in advance. The light turning yellow should not come as a complete suprise…
How much did we spend on the intersection of Domano and 16 to make it safer?
“Whats astounding is the amount of people that are so concerned with the way other people are driving. I even heard of this one clown installing a dash cam. Can you believe it?”
Well played, sir.
Hey, NoWay, no problem! I don’t care how other people drive as long as they don’t run into me! If those clowns do that I will have video evidence! Great!
A driver in Ontario just won a court case when he presented the video from his DashCam. He was stopped in a bumper-to-bumper rush hour traffic jam when the driver of the vehicle ahead of him backed into into instead of going forward, causing a couple of grand of damage. Then this clown claimed that the guy with the DashCam had hit him from behind.
I suggested about ten years ago that the green light should start to flash a few seconds before it turns to yellow. In fact I called in on the Meisner radio show when the topic of traffic safety came up. I was encouraged to send a letter to the minister and I got a reply, telling me what a great idea it was! Then, nothing more.
In some Asian country (Japan, China?) they have a large digital readout beside the traffic light unit which is counting DOWN, showing how many seconds are left before the light changes.
Looks like we got some catching up to do!
“when the driver of the vehicle ahead of him backed into into instead of going forward,” should read ‘backed into him instead of going forward.’
“People also need to learn to read the intersection in advance.”
I drive a car, not an SUV, pickup, van, r even a panel trucks. Even with driving at the posted speed, and a distance appropriate for that speed behind the vehicle in front, and given a left turning lane with traffic stopped to make a turn and a higher vehicle in the lane to the right of me, I can easily be in a position where my view of traffic signals is blocked.
As billposer so nicely pointed out, the number of crashes is not enough of an indicator of the dangers of an intersection. One even needs to go beyond the rate, but also dig much deeper into the way a crash happened and assess ALL aspects of what contributed to the cause.
“Put the “delay” in yourself”.
In the Boston area it is common practice to inch forward at a red light if in the left lane and signalling to turn left, then, as the light turns green, quickly turn left before the oncoming traffic starts to move.
BTW, running a red light as a cause of accident is not even shown as a cause in the above stats, so I wonder why that is the only reason we use. Neither are road conditions (winter) shown.
Really, totally useless info. I’ll go have a look at what is available on the ICBC site.
Ospika and 5th worked great with flashing red lights recently. Were there any accidents? Were there any important traffic delays?
I took some time to look at the stats as presented by ICBC, keeping in mind that there is no road conditions info and traffic count info.
I looked at what appeared to be the intersections with the most crshes and then alo lookd at the casualties for those intersections so that at least, over a 5 year period, I was able to get data as to the severity of crashes at intersections, knowing that there are all sorts of other paramaters that come into it, but, over a 5 year period, it tends to average out.
Here are the stats shown as intersection, percentage of crashes which have injured people and total number of crashes over 5 years.
I will give some other info in a following post.
Sortered in order of casualties/crash
H16, Cowart, Vance44.44%9944
H97, austin44.29%7031
ospika, 542.71%9641
H16, Domano, Tyner, turning lane41.57%267111
massey, carney40.40%9940
H16, Ferry39.42%20882
foothills, north nechako39.24%7931
H97, H16, turning lane37.50%17666
15, ospika36.43%12947
H97, central, 535.48%15555
H97, central, 1535.40%22680
massey, ospika35.11%9433
H97, central, 1033.74%24683
15, victoria, patricia31.43%10533
massey, westwood31.03%11636
If one would have the traffic count at interscection, it would put the Domano/Hwy16 intersection even lower.
In addition, the 2008 stats for domano/16 were twice as high as other years with the casualty/crash being 54.3%
Looking at total crashes, the intersections look like this.
H16, Domano, Tyner, turning lane41.57%267111
H97, central, 1033.74%24683
H97, central, 1535.40%22680
H16, Ferry39.42%20882
H97, H16, turning lane37.50%17666
H97, central, 535.48%15555
15, ospika36.43%12947
massey, westwood31.03%11636
15, victoria, patricia31.43%10533
H16, Cowart, Vance44.44%9944
massey, carney40.40%9940
ospika, 542.71%9641
massey, ospika35.11%9433
foothills, north nechako39.24%7931
H97, austin44.29%7031
One third of all crashes occur at an intersection with Hwy 97 going through the City. one quarter of crashes occur because of Hwy 16 going through the city. In other words, we should have provincial and federal help for fixing the problems.
“one quarter of crashes occur because of Hwy 16 going through the city. In other words, we should have provincial and federal help for fixing the problems”
Here I always thought crashes occurred due to stupid drivers.
Thanks for clearing that up Gus.
In my opinion, ICBC records intersection data inconsistently which can make some intersections which are complex and dangerous look much safer than they actually are.
The 5th, 10th, and 15th crossings of Central/hwy 97 are shown as multiple but separate crossings. 10th has 3 corssings, for example – central west, hwy97, central east.
Here are the stats for a 5 year period for each.
10, central west – 25.00%205
10, 97 – 39.29%11244
10, central east – 29.82%11434
Looking at the 10th/97 crossing there are 112 crashes over 5 years. When one adds them all up, there are 246, the second highest in town.
Remember that the data for domano Hwy 16 includes he turnng lane as does the Hwy 97/16 interchange.
The combination of the 3 crossings (5, 10, 15) of the so-called bpass account for 87% of the crashes of HY 97 going through PG and 69% of the casualties.
The mney spent to improve 5th and bypass seems to have been well spent. It has the fewest crashes by far of the other 2 crossings.
In my opinion, this is the part of the Highways that needs improvement! Does City Hall know this an what are they doing about it?
Cool and informative map. Grade Three class at some elementary school supply it?
It sure would be nice if ICBC would provide the raw data so that other people could study it. You can download a “workbook” for the program they used to make the map, but a simple data file, say in CVS format, would be preferable.
What I am wondering is whether the ICBC folks know how to analyze this kind of data and are merely providing this not terribly useful map as a toy for public consumption or whether this is actually how they do their own analysis?
This is high level data. It is good enough to give a traffic engineer the locations to look at in more detail. The data that goes into this map is simple â year, city, lat/long of crash, location flag (intersection for example), crash type, and number of crashes.
A table is viewable and can be customized. However, I have not been able to find a way to export it into an excel or access database file.
I have worked with WCB data. They provide high level data such as this about claims under several categories. One looks for some anomalies then, if you are cleared for a legitimate purpose, you can get access to actual claim files which have details shown anonymously. Such data mining results in a variable data which can be both incomplete, be inaccurate that is not discoverable as well as obviously inaccurate.
I expect data veracity from police and other investigative reports to be very similar to the problems which can be observed in WCB claim files. Human error.
Why not just drive your car and stop worrying about what everyone else is doing? Get a job,Get a life and you won’t have time to worry about me tailgating you.
It’s called defensive driving super tech. If you aren’t paying attention to the drivers around you they could take you out! If you take that 2 second pause when that light turns green it could save your life. If you can avoid that idiot who is going to rear end you why wouldn’t you! I love tailgaters as I make sure they don’t get around me but if they do I wave at them at the next light as I cruise on by.
So deliberately aggravating other drivers is your idea of defensive driving???
So deliberately aggravating other drivers is your idea of defensive driving???
New Years Eve 1983, green light, I stopped, passenger “why did you stop light is green”, Me “just a feeling” at that momment another car went speeding through the red light. In the split second I choice to stop I saved both our lives. That is defensive driving.
10th & the bypass, light turned green as I came up to intersection (2 seconds or more) when I went through, heard screeching brakes as a chip truck stopped just before hitting me. Found out you need longer than 2 seconds when you are on 10th as there was a few chip truck drivers that did not feel like stopping at 10th.
5th & bypass, light turned green in the left turn lane but on the bypass one chip truck stopped but two other chip trucks in the other lane rolled right through. The chip truck that stopped was at the interesection first so the other two had time to stop. By the way car behind me honked but now I always make sure the traffic on the bypass is stopped before I go.
16 casualty crashes at 16 and domano in 1 year??? I surely don’t believe that for one instance. I like near there and its defimately no where near there. Someones facts are out to lunch.
I am not sure where you read the casualty crashes for that intersection. You may have been reading the highway number of 16. Here are the nyumbers from ICBC’s data from their web page – year, total cerashes, casualty crashes, percentage of casualty crashes per total crashes.
2007612134.4%
2008703854.3%
2009542240.7%
2010381334.2%
2011441738.6%
I believe there was one major accident in 2008 which caused the high proportion of casualties.
I am not sure, but I believe the total number of crashes was lowest in 2010 because I believe that was the year of re-cnfiguring the intersection.
So far, the crashes and casualties have dropped, but there is only one year of data other than the construction year.
[url]http://www.opinion250.com/blog/view/13582/31/contract+awarded+for+16-domano+upgrade?id=&st=6795[/ul]
Contract awarded august 2009 …… Neat how stats can paint a picture that leads one to “drill down” a bit deeper into info.
http://www.opinion250.com/blog/view/13582/31/contract+awarded+for+16-domano+upgrade?id=&st=6795
Hawaii has the digital readout as well and it sure is nice!
Comments for this article are closed.