


South Fort Children Least Prepared for Kindergarten
By 250 News
Wednesday, September 22, 2010 04:14 AM
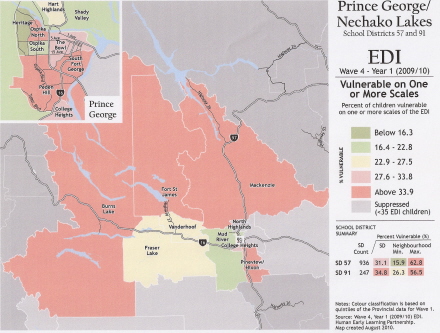
Click on map for more detailed visual of this and other maps from the study.
Prince George, B.C.- A new study by Human Early Learning Partnership (HELP), at UBC, indicates close to a third of kindergarten students are behind in key areas when starting school and too many never catch up. What is even more startling, is that children from the neighbourhoods of South Fort George in Prince George, and Chilliwack North are listed as being the most “vulnerable” that is, being behind their classmates in one or more of five key areas.
Those five key areas make up the Early Development Instrument which measures kindergarten children for their levels of development in language, communications, social, physical and emotional health. The results are tabulated not by the schools they attend, but from the neighbourhoods they call home.
In the 53 of 59 school districts that provided data in 2009/10, 30.3 % of kindergarten children were vulnerable, up from 28.5 % in those same districts last year. In South Fort George, the level of vulnerability is 62.8% this neighbourhood also had the highest proportion of children vulnerable with one in every two children falling below the development mark in one or more of the 5 key areas.
“Since we started tracking the progress of B.C. children 10 years ago, we can clearly demonstrate that child vulnerability is trending upwards,” said Dr. Clyde Hertzman, Director of HELP, Canada Research Chair in Population Health and Human Development and Professor in the School of Population and Public Health at UBC.
“Anything more than 10 percent is avoidable under optimal conditions of early childhood so about two-thirds of the developmental vulnerabilities that B.C. children currently experience as they start school is preventable.”
Key Findings in Prince George:
• College Heights had the lowest level of vulnerability of all of the neighbourhoods (11.9%). It was the only neighbourhood with less than 15% vulnerability in Prince George in 08/09.
• The largest decrease in vulnerability was in College Heights.
• There were also decreases of greater than 5% in McKenzie, Ospika North and Peden Hill.
• Ospika South had over 43% of children vulnerable on at least one scale of development.
• The largest increases in vulnerability were in Shady Valley and Heritage.
• Overall, four neighbourhoods had increases of greater than 5%
“There is a great deal of neighbourhood inequality in children's development in part, to family and neighbourhood socioeconomic factors, but also to things that are not directly related to incomes such as access to quality early learning and care programs,” explained Hertzman.
The data helps government and communities guide policies, programs and services for children and parents based on each community's identified strengths and needs.
Previous Story - Next Story
Return to Home

If you want your children to excel, they need to learn from examples. If your a dead beat parent, guess what, the toddlers and pre kindergarten kids are not going to know any better.
Parents need to do their part, it is not the states responsibility to give all the education and experiences to our children.