Mayor’s Task Force Looks for Feedback on Draft Recommendations
Friday, September 6, 2013 @ 4:00 AM
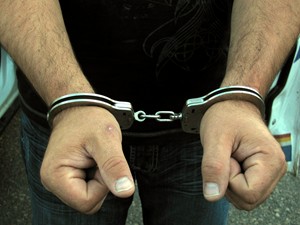 Prince George, B.C. – The Mayor’s Task Force on Crime has put out the call for your thoughts on what can be done about crime in Prince George.
Despite the fact the number of files in Prince George has dropped from a high of 48,803 in 2006 to 36,396 in 2012, Prince George has been listed as number 14 in the crime severity index for communities in all of Canada.
The stats also show that with the exception of Aggravated Assaults and Weapons Possession cases, there has been a decline in most serious crimes in the City. Yet, the City can’t shake the perception of it being a dangerous City, or crime riddled.
Below, crime stats from 2008, with the highest in each category in bold:
|
Crime
|
2008
|
2009
|
2010
|
2011
|
2012
|
|
Murder
|
2
|
3
|
8
|
0
|
2
|
|
Sex Assaults
|
48
|
71
|
77
|
71
|
69
|
|
Assaults (common)
|
727
|
776
|
815
|
789
|
767
|
|
Assaults (aggravated)
|
286
|
284
|
302
|
254
|
305
|
|
Robbery
|
85
|
89
|
92
|
75
|
76
|
|
B&E
|
655
|
668
|
729
|
578
|
568
|
|
Theft from Motor vehicle
|
975
|
1130
|
1403
|
1053
|
800
|
|
Theft of Motor Vehicle
(Over $5K)
|
242
|
208
|
192
|
152
|
86
|
|
Theft of Motor Vehicle
(Under $5K)
|
149
|
138
|
118
|
129
|
62
|
|
Possession of Stolen Property
|
99
|
82
|
83
|
128
|
118
|
|
Mischief
|
2000
|
2350
|
2340
|
2065
|
1465
|
|
Weapons Possession
|
109
|
94
|
128
|
129
|
158
|
|
|
|
|
|
|
|
While the stats would indicate 2010 was the worst from crime in the past 5 years, it should be noted the introduction of BAIT vehicles has had a significant impact on reducing the numbers of vehicles stolen. It should also be noted that when the new Superintendent, Eric Stubbs, took charge of the P.G. detachment, he made it very clear he was going to focus on getting weapons off the streets, and that focus may be the reason why there has been an increase in the number of weapons possession charges.
The Mayor’s Task Force on Crime has developed 7 recommendations in four categories and has issued a call for your thoughts on the recommendations, or what you think can be done to reduce crime, and change the image of the City. Some of the draft recommendations are already being carried out, such as the targeting of crime hot spots:
Prevent and Deter
1.Improved Service Coordination – High Risk Youth
Based on the success of the Homelessness Intervention Project launched in 2009, it is intended that this
project focus on enhancing the integration of services in Prince George in a way that best serves the
needs of high risk youth. Through the establishment of collaborative and cooperative teams and the
utilization of person-centered care management, individualized plans will be developed to ensure high
risk youth have access to necessary supports like stable housing, mental health and addictions services,
life skills, community living supports and/or employment supports.
2.Implement a City Watch Program
City Watch is a CUPE BC program. It is designed to prevent and reduce crime by training municipal
workers to identify and alert police to suspicious activities they might witness while on the job. City
Watch involves the formation of community partnerships to enable municipal employees, who work in
virtually every corner of the community, to provide “more eyes on the street”.
Apprehend and Prosecute
3.Identify and Map Crime “Hot Spots”
The process of identifying, monitoring, apprehending and convicting offenders requires research and
analysis. Understanding the process by which each of the crimes is committed and establishing the
frequency by location allows police efforts to be focused. City of Prince George resources (Geographic
Information System) will be coordinated with RCMP resources (Crime Analyst) to identify and map crime
“hot spots”.
4.Target Identified Crime “Hot Spots”
Identified crime “hot spots” will be targeted with an integrated response involving Police, Bylaw Services
and Fire Rescues (when appropriate).
Rehabilitate and Reintegrate
5.Implement a Graffiti Reporting and Removal Program
Bylaw 8425, 2012 sets out the City’s standard for the maintenance of property (land and buildings) and
requires property owners to remove graffiti from their properties. In order to assist property owners
with the removal of graffiti, it is proposed that a graffiti reporting and removal program be established
in partnership with an agency (or agencies) providing community service opportunities for offenders.
Perception and Reality of Crime
6.Measure Citizens’ Perceptions of Crime
It is important that accurate information be gathered on a regular basis about citizens’ perceptions of
crime and feelings of safety to ensure that tailored action to address those groups with the most
significant fear or vulnerability can be initiated. This data also informs the design and implementation of
strategies to combat perceptions of crime that do not align with the reality of facts about crime. The last
time an investigation of this nature was undertaken was in 1999 when the Institute for Social Research
and Evaluation (ISRE) at UNBC considered perceptions of crime as part of a broader study focused on
criminal victimization and the quality of life. It is proposed that the City of Prince George engage a
research organization/agency to gather current information, in a statistically valid form, about
perceptions of crime and personal safety.
7.Identify and Prioritize Actions to Address Perceptions of Crime
Information gathered about citizens’ perceptions of crime and feelings of safety will enable the
development of targeted communication strategies and the mobilization of partnerships to reduce the
fear of crime expressed by groups and/or neighbourhoods.
You can offer your feedback on the recommendations by accessing this online survey.
Comments
Huh? Don’t we do that now?
Pretty sure we do, NoWay.
Just off the top, I notice that theft of vehicles is down rather significantly: if this is from the use of “bait cars”, then can this tactic be expanded to other theft crime scenarios? “Mischief” also appears to have dropped significantly: why? Lets find out why crime is dropping and look for ways to accelerate the decline.
When recruiting future citizens for this community, recruit them from low crime rate cities in the eastern part of Canada. They seem to be more civilized.
Of course, it will have the added advantage of increasing the interest in the arts as well.
BTW, the obvious reason we are not improving in the relative standings is that other communities are not static. We have a moving target and we have to move faster than other communities in order to improve on a community comparative scale.
I suggest we plot the change over time against our own community stats as well as the change over time of BC communities, western communities and national communities and then look to see how the various rate changes compare to each other.
I am sure that has already been done, but share that with us if we want a conversation.
BTW, 5 years of history is really not a good indicator of anything in this type of research.
Despite the stats I’ve always felt PG is a vary safe community for the most part.
Drinking downtown after dark can be more dangerous than in some cities, but thats about it.
The street where I grew up we didn’t have any property crimes for at least three blocks that I have ever heard about. Probably safer today than almost any other neighborhood in Canada.
PG has and will always have a few hot spots that reflect poorly on the whole city, but I believe the parochial perception based on those area’s do not give an accurate picture to the full account of the whole city.
What I find missing from all these reports is the migratory patterns of the criminal element. The higher the migratory population, the higher the crime rate within the city. PG is a melting pot of those in need of government services and those who for the most part are finding their way in a much bigger open city as a regional center, as opposed to the more closed communities they came from. How can those people make a transition to a more productive lifestyle is the big question… otherwise its like firefighting always chasing the next flareup.
Courses in social skills, and how to find employment opportunities, and find appropriate mentors for those coming from small impoverished northern communities would go a long way to blunting some of the social ills PG inherits. Its a provincial responsibility though. Like what the multicultural society does for immigrants.
I have looked at the stats a bit closer and have been comparing them to past reports on this site.
I think before we proceed much further we need an independent audit of the stats we are being presented with by the RCMP. Over the years categories have changed, some have been grouped together and some separated out, others appear to be identical, but the numbers reported for the same year, say 2008, are reported differently depending on when the report is issued.
Just as an example for now, 2008 B&E reported in a 2010 presentation by the RCMP was 752, and for 2009 was 807.
Today’s report shows 655 for 2008 and 668 for 2009.
Are the reports dealing with charges or convictions?
blog/view/15612/3/rcmp+release+2009+crime+stats?id=&st=210
Unless one has accurate and consistent reporting of crime stats, one has a difficult time determining success/failure.
Nice to have a search engine on this site along with past articles maintained. Comes in handy at times.
Glad to see protection of personal property is improving, but I hope to see more results in reducing sexual assualt, but Gus is right. These stats don’t mean much…they aren’t even properly labelled. What are we looking at? arrests? convictions?
I reiterate what NoWay said “Huh? Don’t we do that now?”
I would hope City Workers would be on the lookout for crime and suspicious activities as much as non-city worker.
My daughter and I were harassed by a group of people outside the homeless shelter on Dominion last Saturday afternoon (1 p.m.). Maybe if the shelters stayed open all day, they could reduce the numbers of “harassers” on the streets. Makes me think twice about being downtown on a weekend afternoon. Morning seems fine down there but come noon/1 o’clock, it gets scary.
When you see the numbers presented in the table above, there are 12 categories of criminal offenses listed. Totalling them for 2008, one gets 5,377. The highest total of the 5 year periods is 6,287 for 2010.
The total reported previously is considerably over twice those reported today. Did the category of what is a crime change over time?
In previous years 250NEWS reported RCMP statistics as follows:
Total criminal code offences
2005 = 13,882
2006 = 15,142
2007 = 14,152
The stats at that time also listed the lowest year 2000 = 12,563. It does not list the year when stats where first collected.
So why are the total crimes reported in the past
Property crimes were listed as follows:
2005 = 5,861
2006 = 6,481
2007 = 6,224
Lowest 2001 = 5,603
Those figures are higher than the total crimes listed in todayâs table. An explanation would be appreciated!
Break and enter were listed then as:
2005 = 1,068
2006 = 1,101
2007 = 1,185
The source is an August 2008 report on 250NEWS blog/view/10419/10/crime+stats+released,+numbers+down?id=&st=9330
A February 26, 2010 250News report show this:
images/2009%20person%20crime%20types.JPG
Homicide 2008 = 3 (3); 2009 = 3 (3)
Robbery 2008 = 84 (85); 2009 = 88 (89)
Sexual Assault 2008 = 56 (48) ; 2009 = 94 (71)
Aggravated Assault 2008 = 6 (286) ; 2009 = 12 (284)
The numbers in brackets are those reported in todayâs table.
There is likely an explanation, but before the City asks us to provide meaningful and thoughtful input, I think we deserve a clear picture of what the current situation is as well as past over at least a 10 years and preferably longer. In addition, those retroactive numbers need to be reviewed and adjusted to reflect a common counting methodology.
Without that, the entire foundation of the effort is lost.
==============================
So, curmudgeonscurse, I certainly would not come to the conclusion that personal crime has been reduced. The only conclusion I can reach for now is that there is something wrong with the crime reporting over the years. I need an explanation before these stats can become a tool in making decision about what could be done to reduce crime.
One more that I missed with a follow up above:
Break and enter were listed then as:
2005 = 1,068
2006 = 1,101
2007 = 1,185
The figure above for 2008 is 655, the highest since then was 729.
What happened between 2007 and 2008 to cause the figure to be reduced by 40% or so? Different criteria? Who knows? I await a detailed explanation not a generalized BS spin from some communications guy.
No mention of the factory alarm systems in most new cars making a dent on theft of and from them. Bet most of the stolen are still Ford F350 that do not come with factory alarm systems. Most high end domestic cars and trucks had factory alarms since about 1999 but even mid range cars and pickups have them now. A lot have coded keys as well making theft of nearly impossible unless someone gets your key
Thought our favourite mayor was going to implement the Surrey model, wasn’t that why she went down to the lower mainland a few months ago?
Don’t forget numbers would be a lot higher if home/business owners were not concerned their insurances would go up if reported on insurance claims on break and enter, theft etc. Even with ICBC, for some, it is not worth reporting.
A little slap in the face for the police, just like saying they can’t do their job right.
“No mention of the factory alarm systems in most new cars making a dent on theft of and from them”
Surrey figures:
Quarter 4 in 2012 versus the same quarter in 2011 shows an increase from 521 to 964 in Surrey.
Theft from vehicles the figures moved from 1,472 to 2,255 in the same two periods.
source = RCMP web page:
http://surrey.rcmp-grc.gc.ca/ViewPage.action?siteNodeId=1496&languageId=1&contentId=29063
Surrey did not grow that much and Surrey would have similar cars.
Unless there is a credible explanation for the increase, such as access to new technology on the part of the thieves, the notion is reasonable, but not really applicable.
Prince George RCMP web page has very little crime statistic info on it when it is compared to Surrey.
http://princegeorge.rcmp-grc.gc.ca/ViewPage.action?siteNodeId=1031&languageId=1&contentId=26402
However, the above has a graph showing the homicides in the city. Again more discrepancies compared to the above table
The first for each year listed is the figure from the above table; the second is from the graph on the linked page.
2008 – 2 – 5
2009 – 3 – 3
2010 – 8 – 7
2011 – 0 – 0
2012 – 2 – 2
So why the differences in 2008 and 2010?
Also, why does the PG site not provide more detailed reports such as are presented in Surrey? Do we not have the same contract locally?
That is true gus, look in the year to date column and you get an increase of 15% in 2012 over 2011. 2013 in Surrey is up also from 2012 although overall crime is consistent because of a drop in violent crimes and assaults. The top 3 cars for theft of and from in Surrey 2000/1999 Honda Civic, 2006 trailblazer, 2007 Ford F350. None of these vehicles have coded key but two do have factory alarm IF you lock the doors with the remote fob. Factory alarms do not go off if you lock the doors with the power lock button on the door. Pull the wire to the horn and a factory alarm is disabled and unless it has a coded key it can be stolen the old fashioned way.
Stats Canada says 20% of all cars in Canada that are stolen have the keys in the ignition in 2012.
A Stats Can report from 2008 put the number of 16-year-olds accused of auto theft in Canada at about 320 per 100,000, compared to, for instance, about 25 per 100,000 for 45-year-olds. If this is true we have about 240 young kids looking for a ride to steal and 18 – 45 year olds in Prince George. That is a lot of people looking to take your car off your hands.
Is a ‘file’ a criminal code violation? If so we are in trouble considering Surrey with over 400,000 people had just over 40,000 CCVs
Comments for this article are closed.